Observation vs submission
Observation vs submission
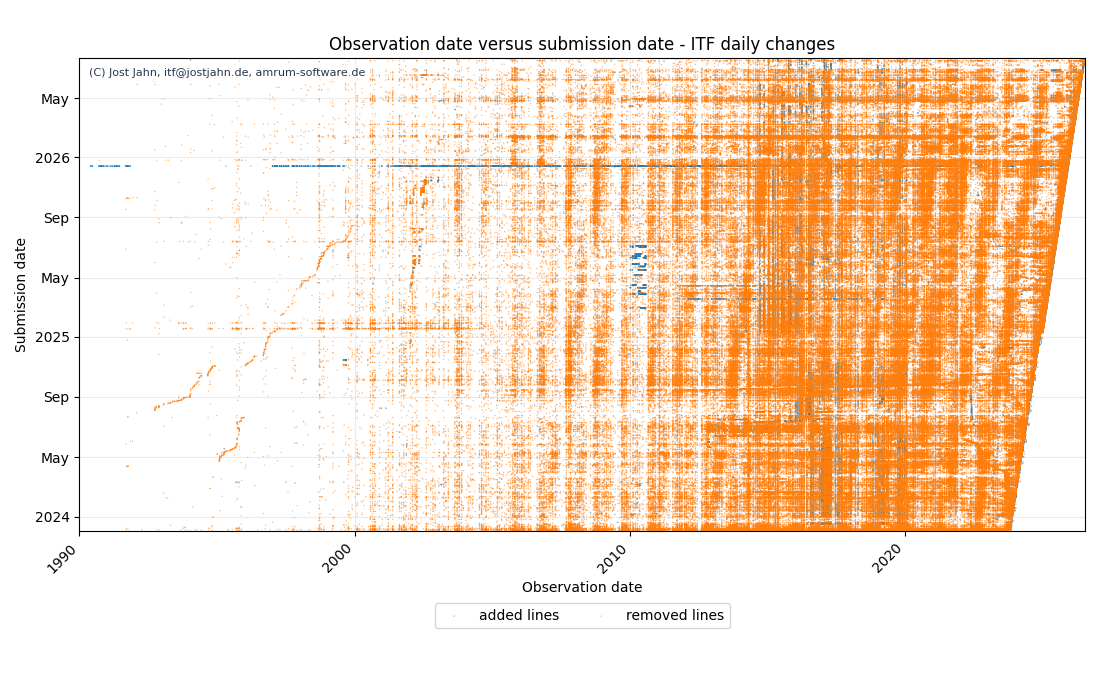
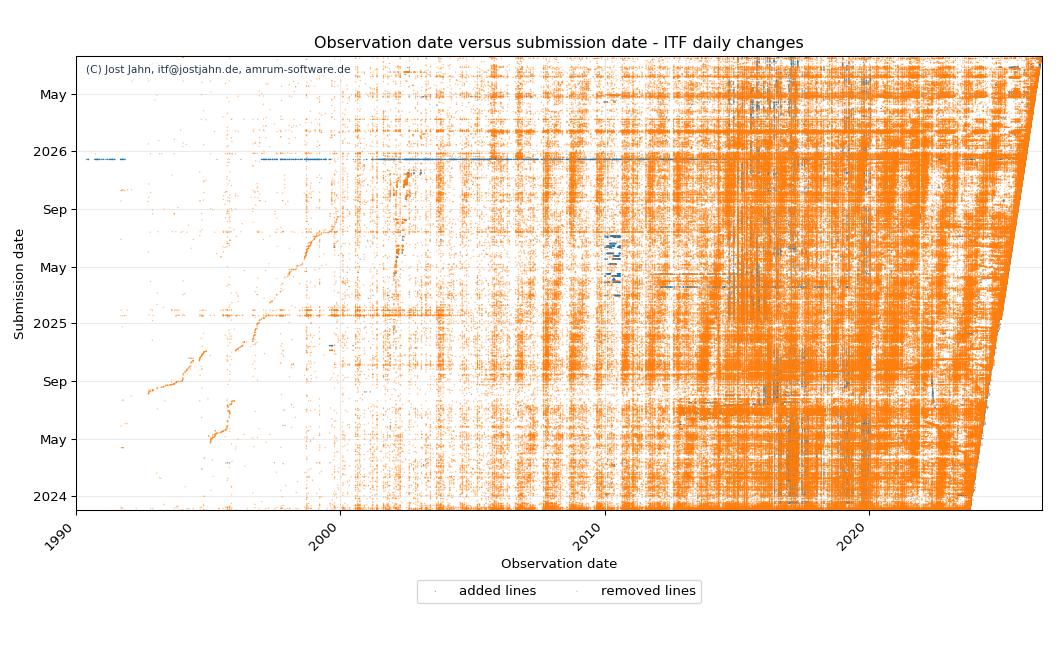
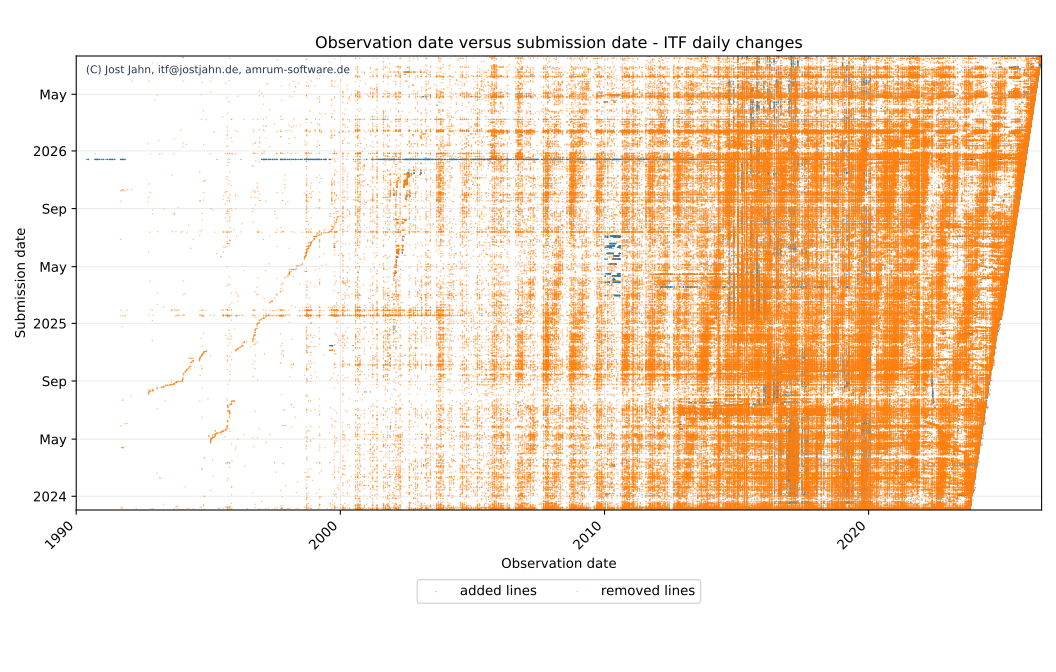
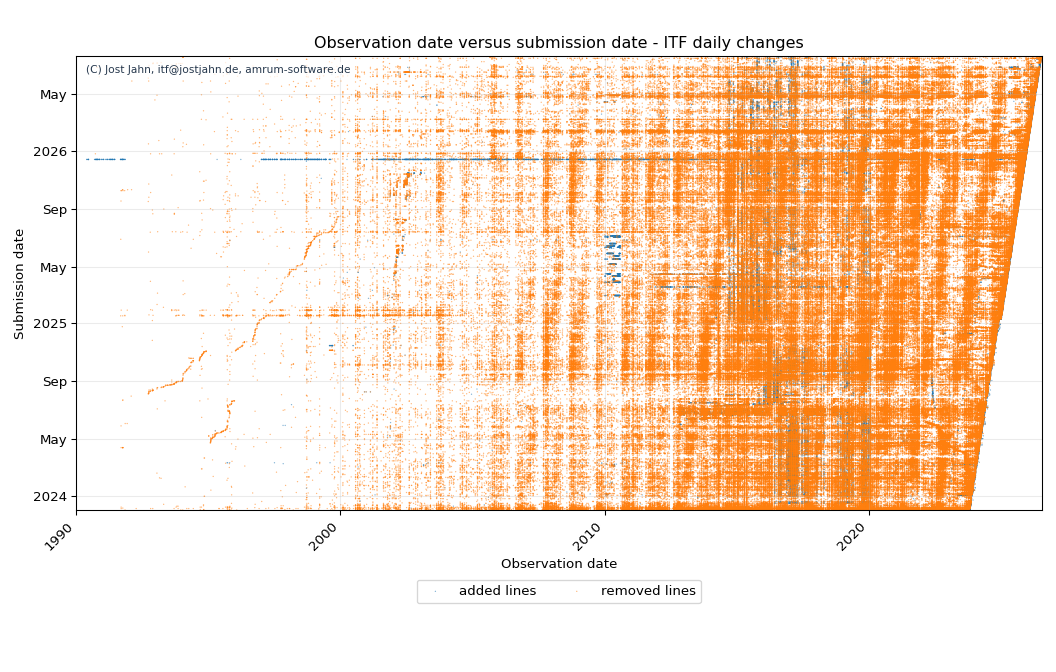
This scatter plot compares the observation date from the OBS80 line on the x-axis with the daily submission-file date on the y-axis. Points are aggregated by date pair and drawn as fixed one-pixel markers; the observation-date axis starts at 1990.
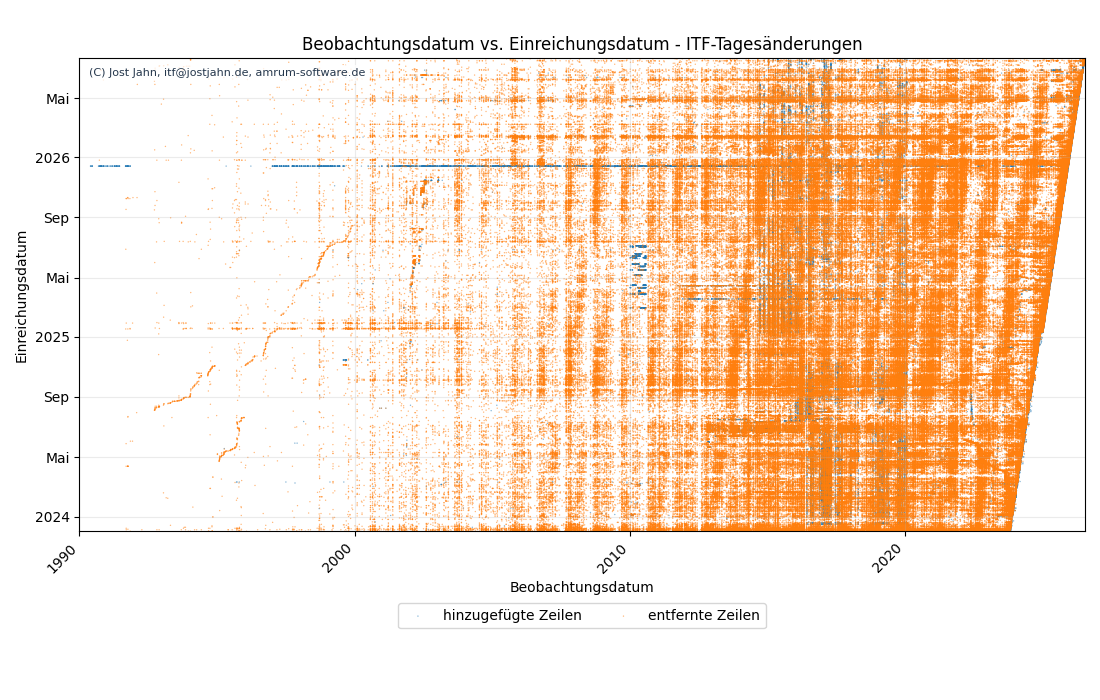
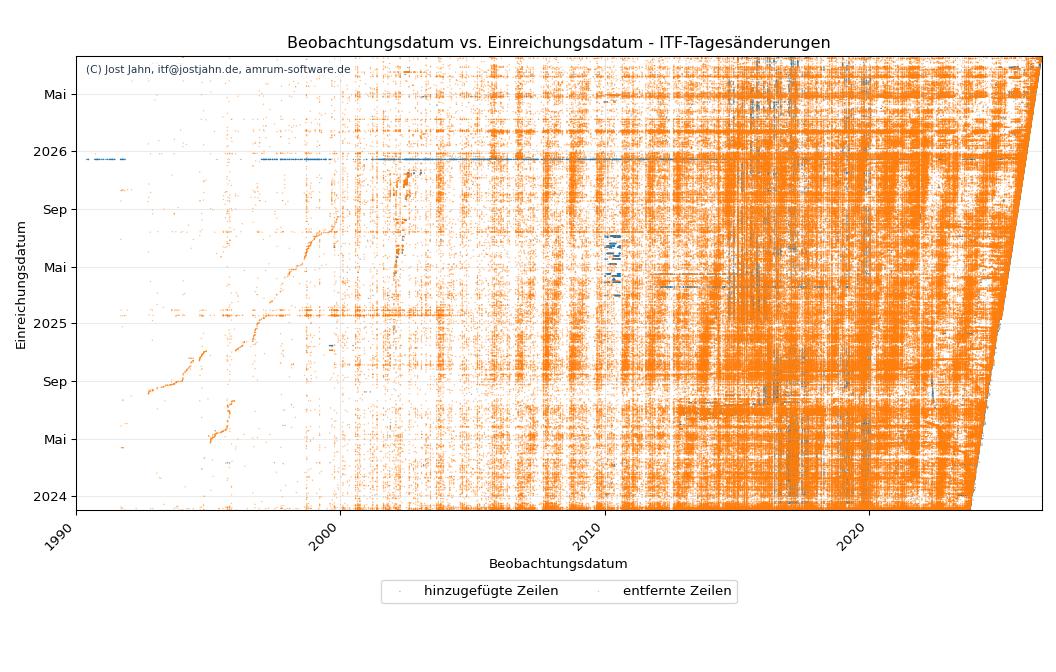
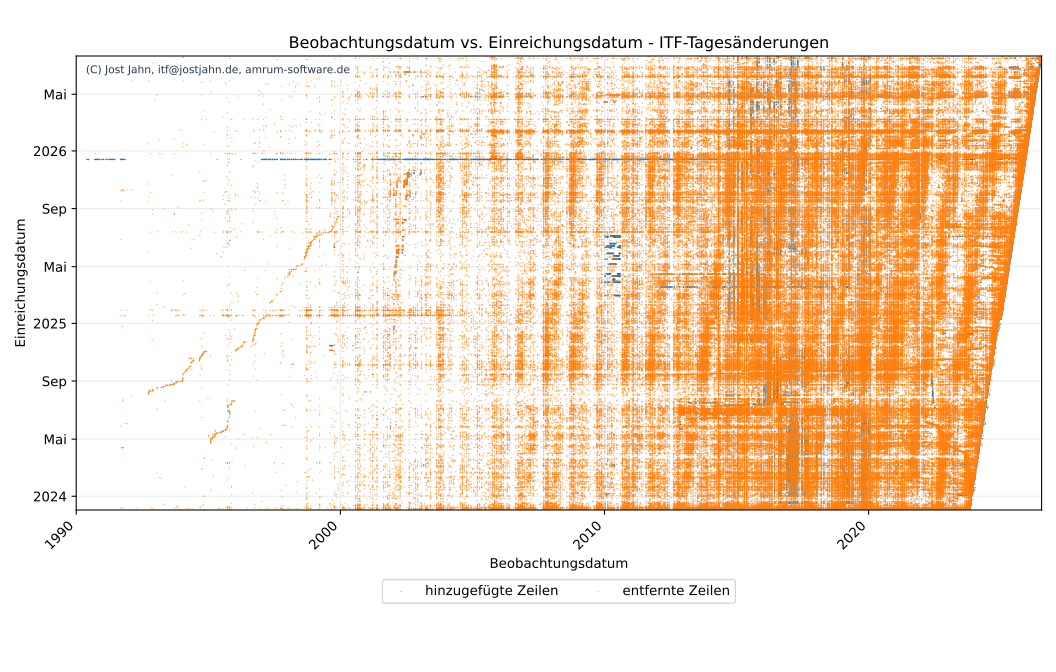
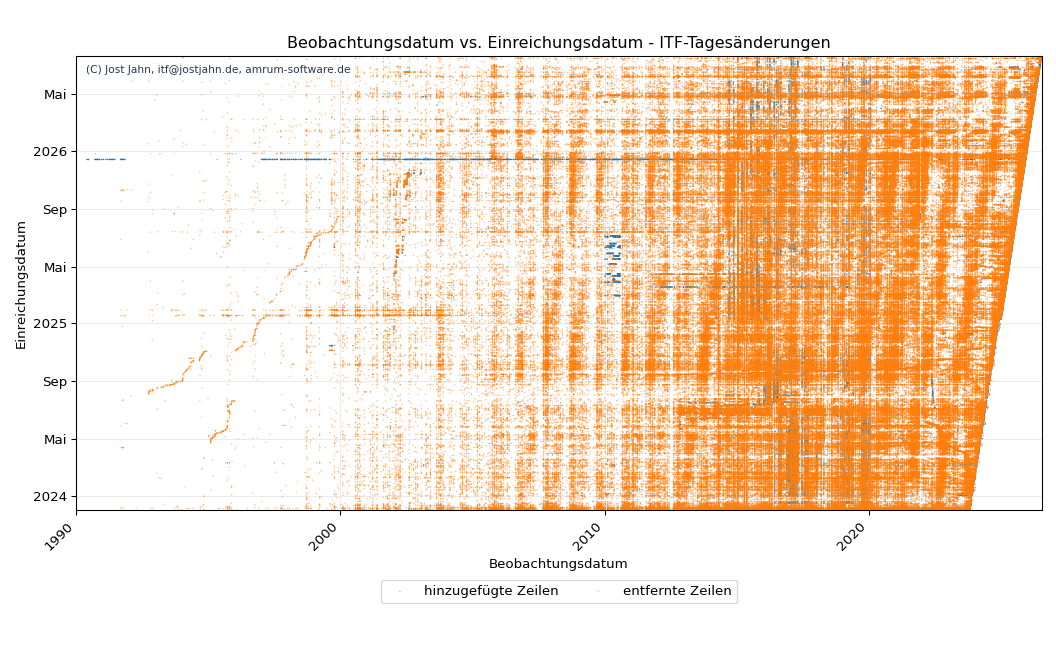
Diese Scatter-Grafik vergleicht das Beobachtungsdatum aus der OBS80-Zeile auf der x-Achse mit dem Datum der täglichen Einreichungsdatei auf der y-Achse. Punkte werden je Datumspaar zusammengefasst und als feste Ein-Pixel-Marker gezeichnet; die Beobachtungsdatum-Achse beginnt 1990.